Finding Covered Call Opportunities Using Technical Analysis
As an equity investor, you want to try to maximize the upside potential of your stock holdings, but there are times when the market is trading rangebound or more likely due for a correction. During these times, writing a covered call makes a lot of sense. In this lesson, I am going to teach you my preferred method for finding solid covered call candidates using a technical approach that combines Bollinger bands and key supply levels.
Before I get into the nuts and bolts, let's briefly discuss what both of these are. Firstly the Bollinger band is a technical indicator which measures the volatility of a stock or financial instrument. The Bollinger band consists of three lines, the center line which is typically a 20 period moving average, the upper line, which is typically considered a resistance line, and a lower line, which is typically considered a support line.
The upper and lower lines are determined based on a standard deviation setting from the center line. The default is typically set to 2 standard deviations. The Bollinger bands study is very useful in pinpointing price extremes and for finding mean reverting opportunities in the equites market.
The second technical tool I look for is what I call key supply levels. These are critical areas on the price chart where price has reacted sharply to the downside. You may be thinking that this sounds like a resistance level or a swing high. But there is a difference. A resistance level or swing high is an area where price has found a ceiling but that does not necessarily make it is key supply level.
A key supply level has the additional requirement of reacting sharply lower from that level. What makes key supply levels important is that it shows us on the chart the level where there is likely strong institutional selling interest. The sharp drop in price is a footprint of that activity. And we can reasonably expect that when price returns to that level in the future, that we should likely see further selling.
To clarify this visually, lets take a look at the daily chart of Home Depot:
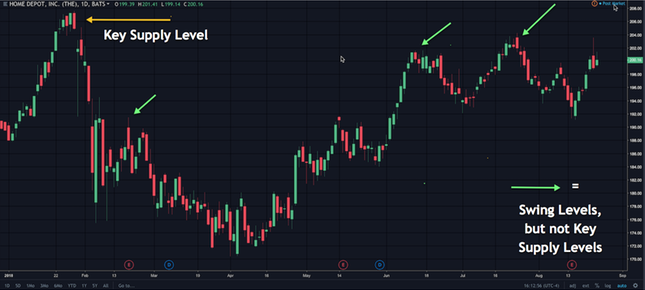
You will note 1 yellow arrow and 3 green arrows on the chart. The yellow arrow points to a level that is considered a key supply level. Notice how sharply price dropped from the area. The green arrows point to swing highs but which do not constitute key supply levels, because price did not drop intensely out of that level.
Now that you understand the basics of Bollinger bands and key supply levels, we can now incorporate that into a covered call strategy. Each of these analytical studies are useful by themselves, but when you combine them, it becomes a much more powerful market timing strategy.
So the core strategy would be to write a covered call above a key supply level, when the price approaches it again and when price has touched or breached the upper Bollinger band at the same time. When this occurs, we can be relatively safe in assuming that a retracement in the stock is likely. And as such, we want to sell a call against our stock position to earn a premium during this likely correction phase. I prefer to sell an ATM call below the key supply line. I opt for the monthly cycle with at least a few weeks to expiration and either hold till expiration or until I capture about 65% of the premium.
Let's take a look at this technical setup on the chart. Below you will find the daily chart of Norwegian Cruise Lines (NCLH).
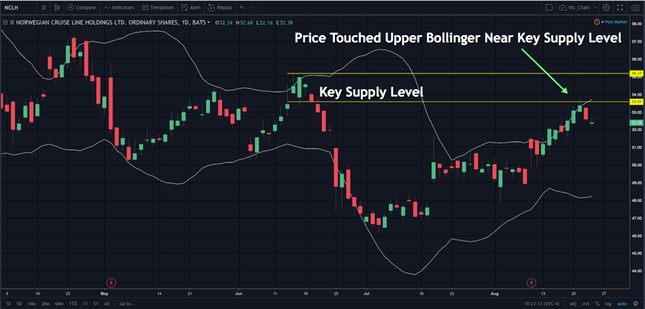
You will see the key supply level marked by two horizontal yellow lines. The Bollinger Band is also plotted on the chart. For ease of viewing, I have only included the upper and lower Bollinger indicator and removed the center line indicator from the chart. Notice how sharply price fell from the key supply level. This occurred in mid June 2018. It tells us that there was strong institutional selling interest at that level which put pressure on the stock. We expect that when prices return to that level, we should see further selling.
As price approached that level in late August 2018, we can see that is was accompanied by prices trading at the upper range of the Bollinger line, penetrating it several times. The first down candle would be an opportune time to write a covered call in NCLH, as we would expect selling pressure to enter the market.
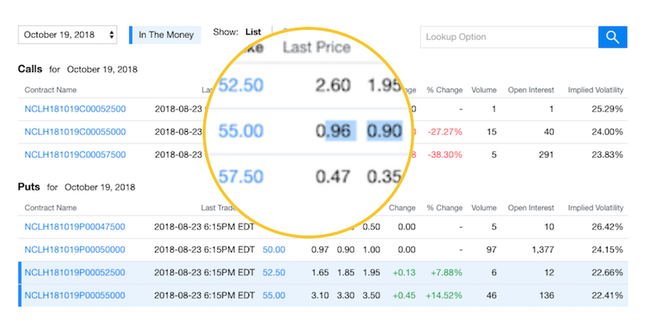
We would want to setup our covered call position by selling an ATM call based on the monthlies with at least 3 weeks to expiration. So based on that we would write the October 55 call on NCLH and collect a premium of around .96. I would hold until expiration or until I lock in 65% of the premium, which in this case would mean buying back the call around .35 or so.
Vic Patel is a private trader and educator at Forex Training Group. Vic has extensive knowledge and experience in the Equities, Options, and Forex markets.