Covered Call Blog
How to use covered calls to generate recurring income.
Most Recent
Most Popular
By Topic
By Symbol
Receive new blog articles automatically by following us:
![]() Email newsletter
Email newsletter
![]() X
X
![]() Facebook
Facebook
![]() YouTube
YouTube
![]() LinkedIn
LinkedIn
Do you have an idea for a topic you'd like us to write about? Please contact us.
Callan Evaluation of BXM vs S&P 500
Callan Associates evaluated the CBOE S&P 500 BuyWrite (BXM) Index, building on the research done by Ibbotson in 2004. Return, risk and risk-adjusted performance were examined over an extended period and through cycles of up and down equity markets.
Summary Of Results
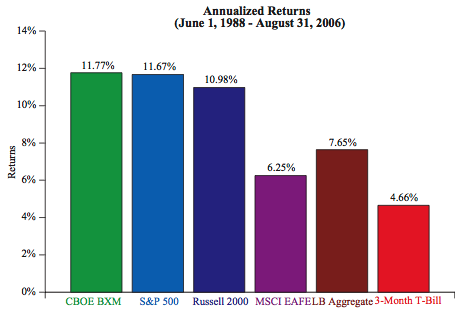
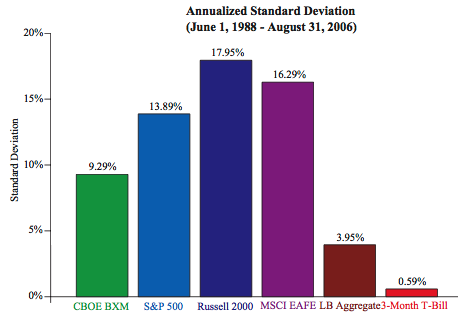
The results show that the BXM Index generated superior risk-adjusted returns over the 18-year study, generating a return comparable to that of the S&P 500 at approximately two-thirds of the risk. The compound annual return of the BXM Index from June 1, 1988, thru August 31, 2006, was 11.77 percent, compared to 11.67 percent for the S&P 500. The BXM returns were generated with a standard deviation of 9.29%, two-thirds of the 13.89% volatility of the S&P 500.
Cumulative results are dependent on the time period selected for evaluation, so Callan examined performance over individual years, over rolling five-year periods, and through up and down cycles in the equity markets.
The BXM clearly underperformed the S&P 500 during the run-up in the equity market in the second half of the 1990s, and just as clearly outperformed the S&P 500 during the market downturn from April 2000 through March 2003.
The BXM generates a return pattern different from that of the S&P 500, offering a source of potential diversification. The addition of the BXM to a diversified investor portfolio would have generated significant improvement in risk-adjusted performance during the 18-year study.
Better returns:
Lower risk (standard deviation):
Comparisons of Returns and Standard Deviations
During the period studied, June 1988 to August 2006, the BXM Index had:
- Slightly higher returns with substantially lower volatility than the S&P 500 and Russell 2000 stock indexes. Returns are markedly higher than those of the MSCI EAFE index.
- Higher returns and higher volatility than the Lehman Aggregate bond index and 90-day Treasury bills.
- Higher risk-adjusted returns than the S&P 500 as measured by both the Sharpe Ratio and the Stutzer Index. The Stutzer Index is a measure of portfolio efficiency that takes into account the negative skew evident in the BXM returns.
- Lower returns than the S&P 500 in strong equity markets but clearly superior returns in down markets. A monthly buy-write strategy collects premium income but has a truncated monthly upside when the option is exercised above the strike price. Therefore, the buy-write strategy is expected to outperform a pure passive stock index strategy in bear markets and under-perform the purely passive stock index in bull markets.
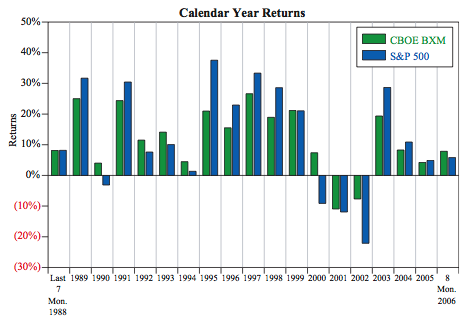
Calendar Year Returns
Comparing the BXM vs S&P 500 each year from 1988 to 2006, where BXM is in green and S&P 500 is in blue, we see that BXM didn't make as much in good years like 1995, but also didn't lose as much in bad years like 2002:
For more data, download the Callan Associates evaluation of BXM Buy-Write Options Strategy.
Mike Scanlin is the founder of Born To Sell and has been writing covered calls for a long time.